
The truth is, when it comes to placing ads there are many different things you want to consider.
Facebook or Google?
Instagram or Twitter?
Reddit?!
The list can go on and on.
Depending on the purpose of your ad, there is a wide range of variables that can affect performance.
And what works for somebody else may not work for your customers, or location, or outreach.
But how do you measure ad performance in the first place?
After all, until you know how you’re doing, you’re not going to know what you need to change in order to improve.
We live in the age of big data, and while that can be a blessing, it can also prove to be troublesome.
Raw data by itself isn’t particularly useful.
Instead, what you need is an understanding and a context of what these metrics mean.
Without a dedicated data department or marketing team who can adeptly sort through every metric for you, you’re left with a vast array of information.
But which are the most important ad metrics, and how do you measure them?
We had Snappy Kraken’s Success & Advertising Specialist, Geoff Cersoli as a guest presenter for the Half-Time Report: 2020 State of Digital presentation.
He shared a list of 6 important ad metrics to help give you a realistic overview of how your ad campaigns are performing.
Watch the video below:
To watch the full presentation, click here.
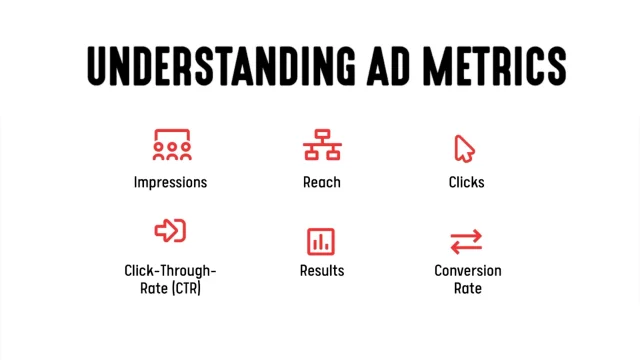
1. Impressions
Impressions mean quite literally the number of times that your advert has appeared where a user has the potential to engage with it.
While that might sound deliberately obtuse, when we say a “user has the potential to”, this is to differentiate it from reach (explained below).
For example, you put a post on Facebook that is seen by 100 followers on the day that you post it.
The next day, it is seen by those 100 followers again.
The number of impressions? 200.
2. Reach
Reach is a similar metric to impressions but involves a little more precision about who you’re reaching.
Rather than how many times your post was seen by anyone, it indicates the number of unique views that your advertisement has had.
So in the example above, your post on Facebook that has 200 impressions has a reach of 100.
While tracking impressions can help you to see whether or not you’re posting too frequently or infrequently, the reach will help you to see how successful your ad is.
If you have a vast reach, but not a single conversion, then you can examine the content of your ad.
3. Clicks
Perhaps the easier metric to understand, clicks – sometimes known as frequency click – is the number of times a user has clicked on your ad link.
On its own, frequency click is not the most useful metric.
However, when combined with the other 5 metrics here, it gives you useful insight into how well your ad is performing.
4. Click-Through-Rate (CTR)
Your click-through-rate, or CTR, is the number of clicks divided by the number of impressions.
This is particularly important because it gives you a general overview of how enticing your ad is to potential visitors.
Each industry has its own typical standard for the click-through-rate, and it’s important not to be perturbed by a low score.
In fact, the industry average for finance is 0.58%.
Yes, that’s right.
So if you’re getting a click-through rate approaching that, then your ad is performing reasonably well.
It’s worth knowing the industry average so that you don’t have unrealistic expectations for your ad performance.
5. Results
Your results rate helps you see whether or not your ads are performing how you want them to.
Each ad should have a single goal.
Say, for example, your aim is to have leads on an off-site landing page.
The results would be the number of clicks that have successfully given you their email address.
As you might expect, this is the easiest way to see how well your ad is performing.
6. Conversion Rate
Your conversion rate is the percentage of people who performed the desired action (the result), divided by the number of clicks.
So if we’re tracking the conversion rate based on leads, your conversion rate is calculated by the number of leads produced, divided by clicks.
Putting Ad Metrics Together
Understanding metrics is really just the first step, but it’s vital for being able to strategize and plan ahead.
In order to understand whether or not you’re spending your time and money wisely before you run an ad campaign, you should have a clear idea of what it is that you’re hoping to achieve.
Is it more leads? People signing up to your newsletter? Making people aware of your brand?
Once you have a clear goal, metrics will allow you to see how near (or far) you are to accomplishing your target.
Want to see more insights and trends? We pulled data from the actual performance of 12,852 active digital marketing campaigns run by individual financial advisers and firms throughout the United States during the first half of 2020. Watch the full presentation and download your free 14-page PDF report here.
Book A Demo Today
Discover how Snappy Kraken helps advisors grow with a powerful marketing system
Request a demoJoin the 25,000+ financial advisors and firms who get marketing insights and strategies right to their inbox!
Enjoy this post? Share it with others.
Wondering if Snappy Kraken is right for you?


